Empirical estimate of shear rates during feeding
Dispensing pharmaceuticals without harming the product
The load on (pharmaceutical) materials is often evaluated by the shear rate in flows. For materials with complex geometries, this is not so easy to calculate. Utilising the thixotropic properties of laponite or similar structure-builders enables empirical calculation of maximum shear rates in apparatus. The resulting specific shear rates for peristaltic, diaphragm and progressive cavity pumps are determined and compared using rheological model equations. It can be shown that the progressive cavity pump has the lowest shear rate at the same volume flow. Furthermore, a proposal for the determination of viscosities of any non-Newtonian fluids in feeding processes is introduced.
Many pharmaceutical products require very careful feeding or filling to ensure safety, stability and efficacy. The interface with biotechnology also places special demands on the compatibility of the feeding technologies, such as in the form of sensitive cells. The influence of shearing on pharmaceutically relevant proteins is often discussed, whereby the focus has shifted from issues of denaturation to general quality impairment. The focus is on product stability, and thus patient safety. Among other effects, shearing can cause the phases of emulsions to separate and so reduce shelf life. Assessing harm to products can be difficult, as very often only long-term tests, empirical values or complex computer simulations produce results.
Especially with complex geometries or moving parts in the product stream, the limits of simulation are quickly reached. It is therefore desirable to find simpler evaluation methods that indicate the loading to which products are exposed. A key indicator of stress is the shear rate. It describes the ratio of the flow velocity of the material to a plate spacing. Many highly viscous products exhibit non-Newtonian behaviour. Since dynamic viscosity is defined as the quotient of shear stress and shear rate, there are also implications in terms of precise dispensing and plant design. If a material exhibits shear-thinning behaviour, for example, it can be assumed that the product is more fluid in moving process steps and behaves differently during processing. Knowing the actual loads can thus aid making the right choice of equipment and improving process control.
The basics of rheology
Rheology concerns the deformation and flow behaviour of various substances. All bodies have elastic and viscous components. Ideal viscous fluids are also called Newtonian fluids. So water is almost ideally viscous. Mineral oil, for example, is even more ‘fluid’. Its dynamic viscosity is not changed by variations in the shear rate. Non-Newtonian behaviour, on the other hand, is characterised by variable viscosities due to shear rates. Examples of this are creams that have a degree of stability under normal conditions, but become more fluid under the influence of shearing, and so provide better wetting of the skin. This behaviour can manifest itself as both a shear-thinning and a shear-thickening effect.
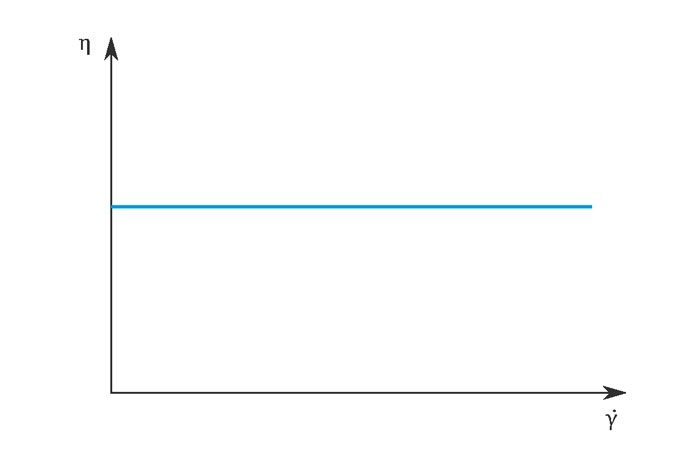
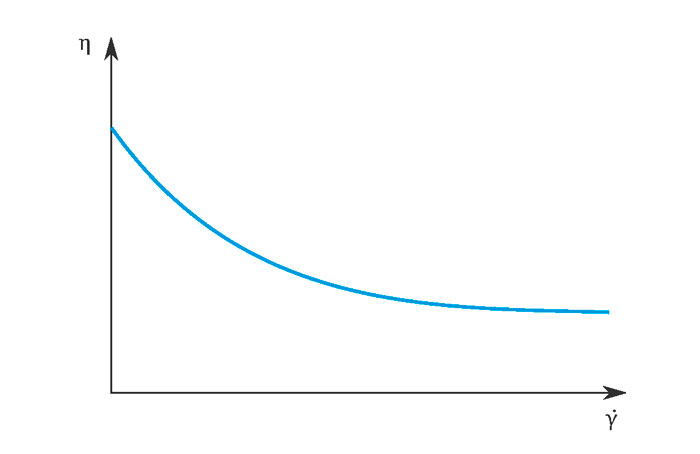
Besides their dependence on shear rates, many substances exhibit time-dependent behaviour. These properties are termed thixotropic for time-dependent shear thinning and rheopectic for time-dependent shear thickening. Thixotropy is explained by the fact that a mesh of structure-builders (such as polymers) in the material is reversibly broken down by the shearing, so reducing the viscosity. Structures are then able to ‘slide past’ each other.
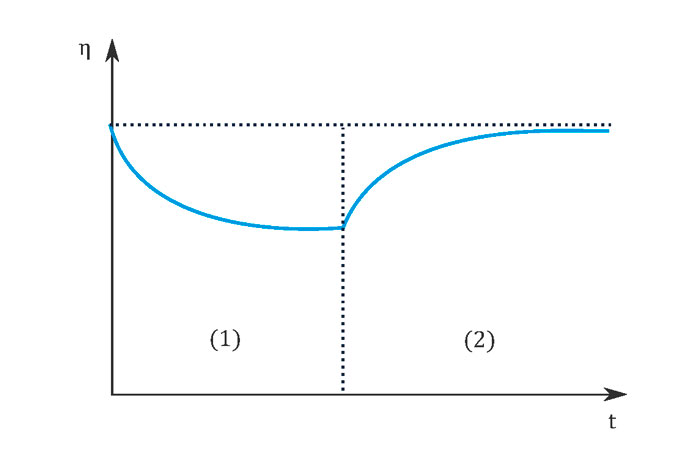
At a constant shear rate, a plateau value is established towards the end of phase (1) in Figure 3 which is specific to the material and the respective shear rate. If the shearing is interrupted, the structure recovers (almost) completely. An example of a thixotropic material is Laponite-RD, which is often used in industry as an additive to achieve the desired flow properties. It forms a gel-like suspension in water.
Modelling of non-Newtonian fluids
There are a number of mathematical methods to describe flow behaviour. Generally, the applicability of the respective model equation requires prior knowledge about the material. If little is known about the product, a more general model should be considered first, which may be simplified and described by fewer parameters later on. A generalised model is provided, for example, by the Herschel-Bulkley equation. In addition to the shear stress τ and the shear rate, this model incorporates the flow limit 0, a consistency index k and the melt flow index n.
Material and methods
A suspension with 4% (w/v) Laponite-RD and Molecular Biology Grade Water was used to determine the rheological parameters. In order to allow complete structure formation after preparation of the test material, the test was started only after 24 hours’ incubation time. A reference curve was determined by measuring the dynamic viscosity at increasing shear rates over 30 data points in the range 0.01 to 100 1/s using a rheometer. For this purpose, about 1 ml of the suspension was applied to the measuring plate and measured with the cone-plate system. The pump-specific shear rates were then determined. For each pump, a fresh 50 ml of the suspension was circulated for 10 minutes at a flow rate of 75 ml/min. The total tube length excluding the pump head was 50 cm in each case.
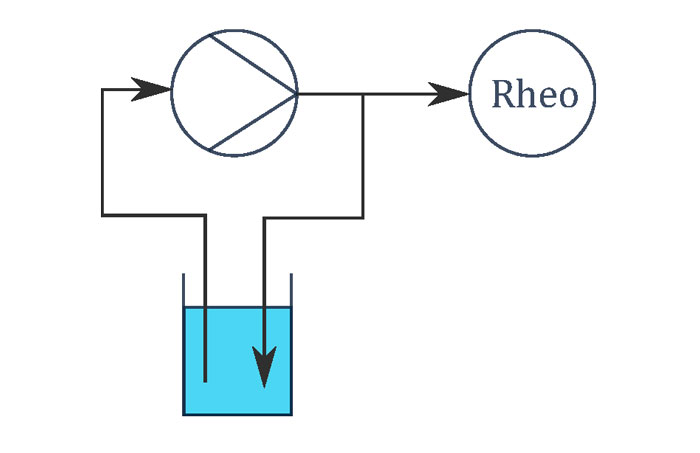
The sample application and start of measurement were carried out as far as possible with no delay, and without additional shearing. To do so, dispensing was carried out directly from the end of the tube (Pumpsil process tube 3.2 x 1.6) onto the measuring plate, and the measurement was started immediately. With a set rotational shear rate of 0.25 1/s, the renewed structure build-up was tracked over a time of 375 seconds, or 750 measuring points on the rheometer. The temperature for all measurements was 20 °C.
Equipment for conducting rheological experiments
| Equipment | Manufacturer |
| Peristaltic pump 323U/D | Watson Marlow |
| Diaphragm pump SIMDOS 10 FEM1.10KT.18S | KNF |
| Pharma Dispenser (progressive cavity pump) 2VPHD-12 | ViscoTec |
| Pharma Dosing Control ViscoDos PH | ViscoTec |
| Rheometer MCR 302 | Anton Paar |
| Cone measuring system CP50-1 | Anton Paar |
Results of the dispensing experiments
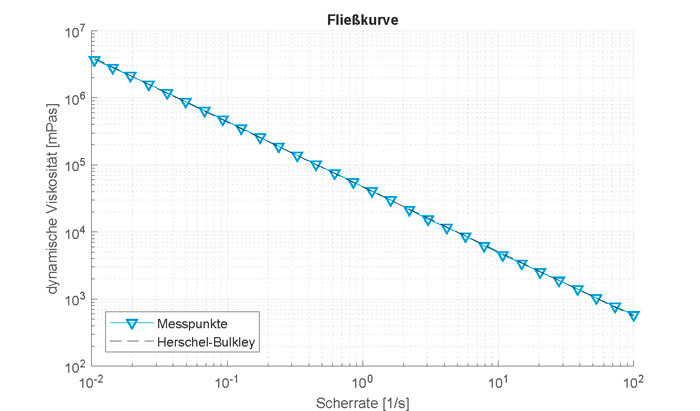
The measured data of the 4% Laponite-RD reference curve were first approximated using the Herschel-Bulkley model. The model provides a very close match to the measured values. In this case, adaptation can also be further simplified by the Power Law model, also known as the Ostwald de Waele relationship. The coefficient of determination R2 for this adaptation is 0.9999, which means it very accurately confirms the model’s assumption. By means of the function found, a dynamic viscosity can be unambiguously assigned to each shear rate in the analysed shear rate range from 0.01 1/s to 100 1/s.
The pump tests show that different specific plateau values are achieved for each pump with the given parameters. The initial values of the structural recovery in Figure 6 correspond to the beginning of phase (2) in the schematic representation in Figure 3.
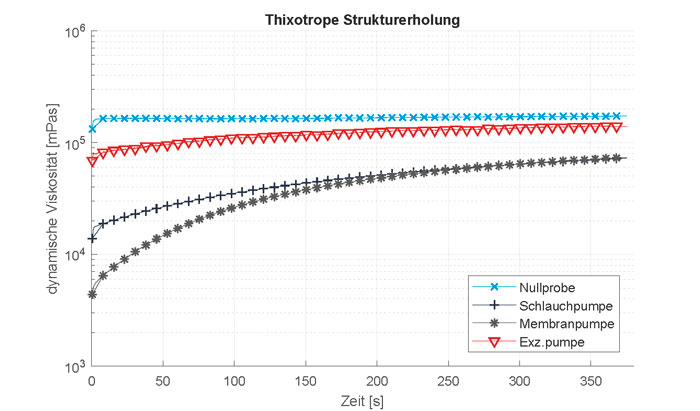
An approximate original plateau value can be read about one second after starting a measurement. The thixotropic behaviour of Laponite-RD makes this measurement possible, as it takes longer for the material structure to recover. For the zero sample, the mean value of the dynamic viscosity at all measuring points from one second after the start of measurement is 167.0 Pas. If the dynamic viscosity formula (see above) is resolved by the shear rate and applied accordingly, 0.27 1/s is obtained as the shear rate for the zero sample. This result deviates only slightly from the expected 0.25 1/s as determined by measurement parameters set on the equipment. A similar method was applied with all the measurement data for the different pumps. Shear rates calculated one second after start of measurement were as follows.
Pump-specific shear rates
| Sample | Dynamic viscosity [Pas] | Shear rate [1/s] |
| Diaphragm pump | 4.99 | 10.29 |
| Peristaltic pump | 16.55 | 2.97 |
| Progressive cavity pump | 81.17 | 0.57 |
| Zero sample | 167.00 | 0.27 |
Thus, the load due to shearing is highest with a diaphragm pump and lowest with a progressive cavity pump. The peristaltic pump is ranked in the middle.
Evaluation of shear rate determination
The results can be used to empirically evaluate the material stress caused by different pump types. Exact specification of shear rates is dependent on the tested material. Laponite is suitable for evaluation because of its good thixotropic properties. The method can be applied in principle to any materials exhibiting thixotropic or rheopectic behaviour. It is important to note that external influences on the measurement must be minimised. The time factor is especially critical. A measurement must be taken immediately after the material emerges from the pump, as this point in time is applied as the initial value for further calculation.
A slow recovery rate is particularly beneficial in the initial range immediately after the shear stress ends. It must also be ensured that the material is circulated by the pump over a prolonged period of time (in this case at least 10 minutes), so as to determine the actual pump-specific shear rate value. In a real-world process, it makes more sense to carry out the measurement directly after the process step under test, with no circulation. This takes into account the actual conditions. Usually, shear rates are only calculated for simple pipe or tube geometries and components in order to clarify design issues. The shear rate serves as a measure of the load, and must be taken into account because of its correlation with the dynamic viscosity.
Consequences for plant design
The strength of the empirical determination of viscosities using thixotropic materials lies in the ‘storage’ of the information. In pipes, the dynamic viscosity can be calculated relatively easily. In more complex apparatus, estimation becomes difficult. It should be possible to plot a dynamic viscosity versus shear rate curve (see Figure 5) for any material and compare it with the curve of the reference material (here laponite). This allows the corresponding viscosity of any material to be determined. This procedure needs be validated by further experimentation.
For validation purposes, a pressure loss experiment can be carried out with a defined pipe and volume flow. The theoretically calculated viscosity can thereby be verified according to Hagen-Poiseuille’s law. If this correlation can be proven, it is possible to adapt plants more precisely to the material and design them as appropriate without the use of computer-aided flow simulations. This will allow material to be conserved, and products to be processed more efficiently and without harm.
